How munpatch works

Built on an open-source command-line tool

This entire site is a browser version of munpatch, an open-source command-line tool developed at Nordregio. The patching rules, the change records and the outputs all follow the original tool — you can read its source and run it yourself at github.com/nordregio/munpatch. The interface here runs the same logic on a server instead of your own machine, so nothing needs to be installed.

The problem

Norwegian municipalities change. They merge, they split, they are renamed, and they get new municipal codes. A statistic collected under the old codes has no value for the new ones, and vice versa, so a time series breaks in the middle. munpatch fills those gaps so every municipality has a value for every year. This is what the breaks look like in Statistics Norway's own tables:
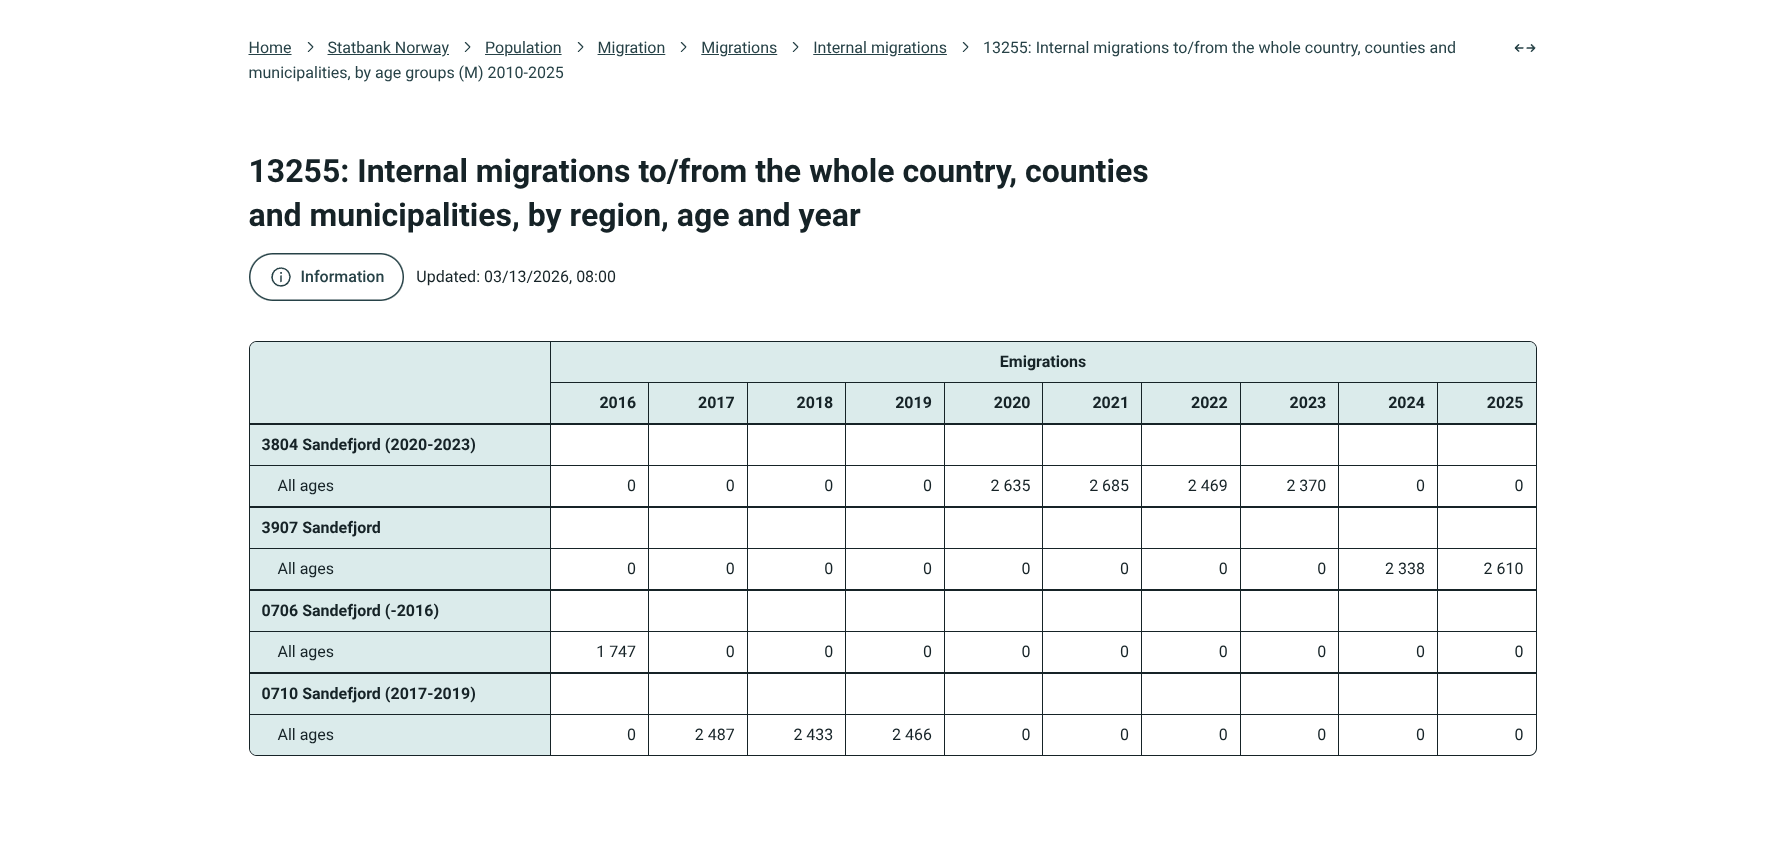
SSB table 13255 showing internal out-migration for Sandefjord under four different municipality codes, each with values only for its own years
Sandefjord's municipality code changed three times (0706 → 0710 in 2017, 0710 → 3804 in 2020, 3804 → 3907 in 2024). In SSB table 13255 (internal migrations) each code only has values while it was valid, so no single code covers the whole decade.
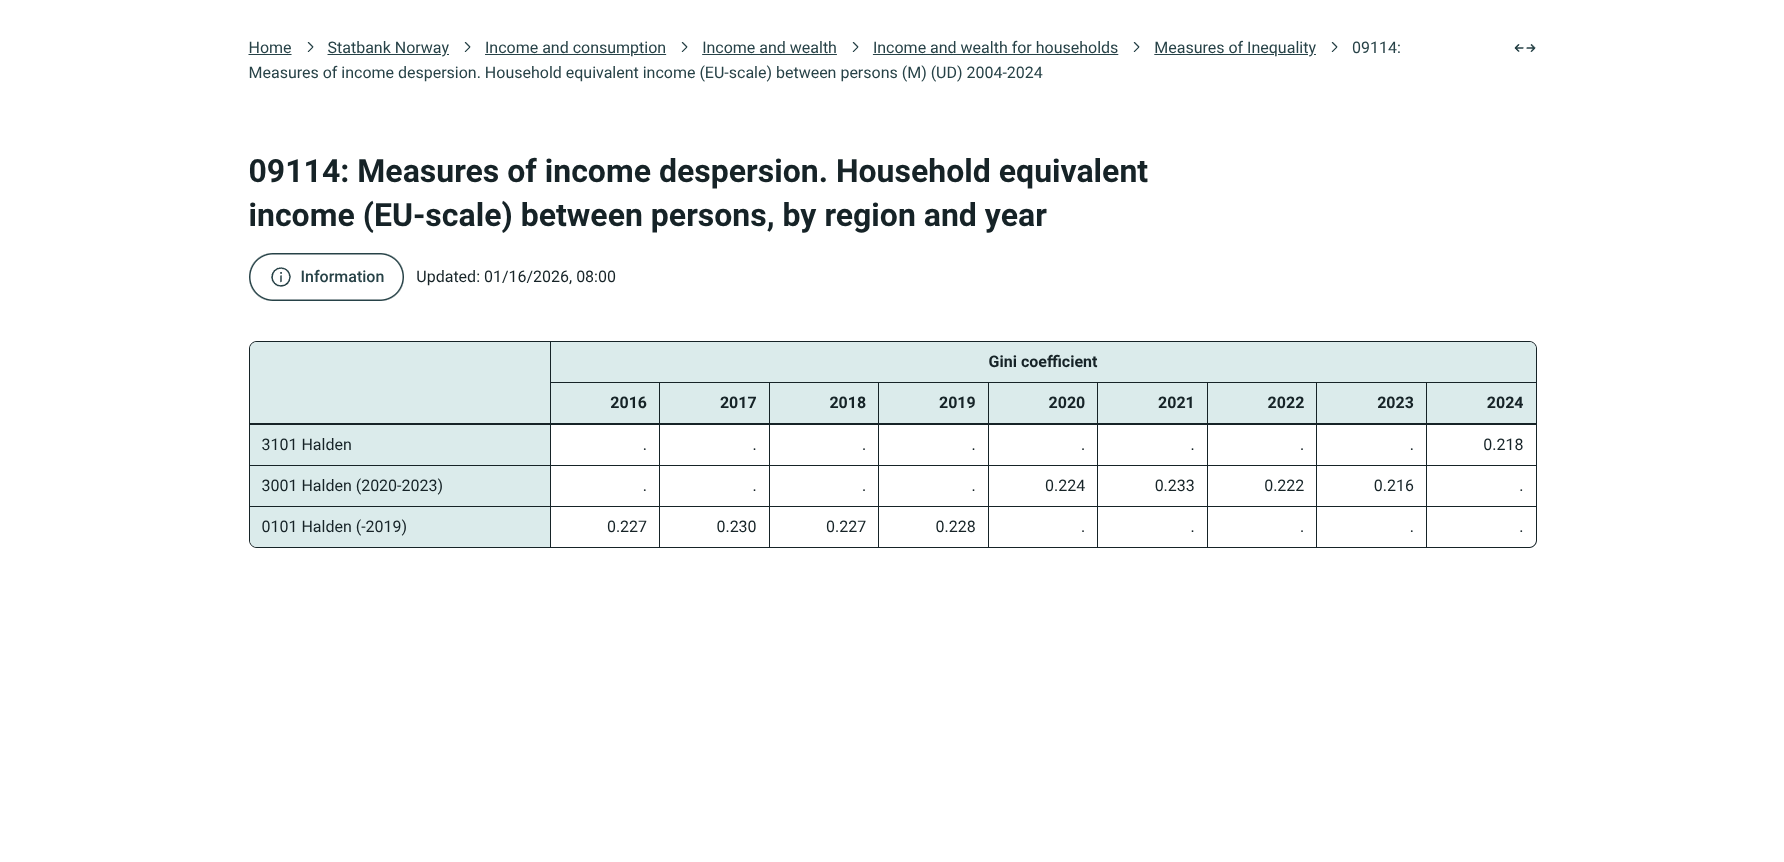
SSB table 09114 showing the Gini coefficient for Halden under three different municipality codes, each with values only for its own years
The same pattern for a rate indicator: Halden's code changed twice (0101 → 3001 in 2020, 3001 → 3101 in 2024), and the Gini values in SSB table 09114 stop at each change.
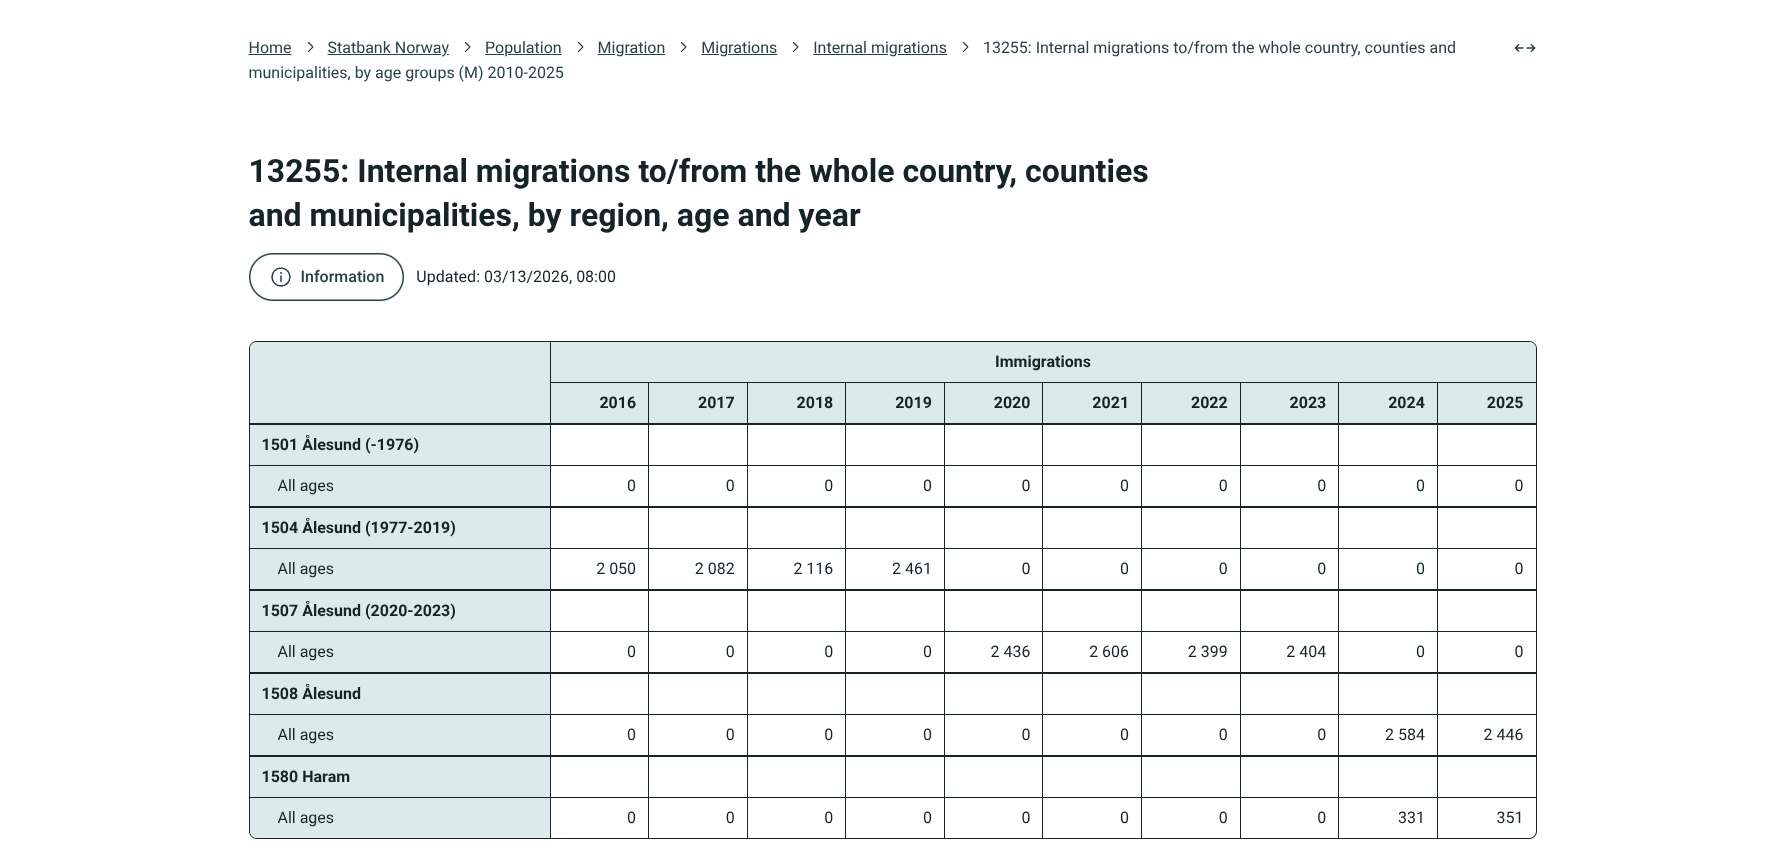
SSB table 13255 showing internal in-migration for Ålesund under four municipality codes plus Haram, each with values only for its own years
Mergers and splits break the series in the same way: Ålesund appears under four codes (1501, 1504, 1507, 1508), and when the 2020 merger was partly reversed in 2024, Haram (1580) came back as its own municipality with values only from that year.

How the patching works

A recode keeps the municipality going but gives it a new number, and the value simply follows it across the change, in both directions in time. When several municipalities merge, the new municipality's value for earlier years is the sum of its parts, and going forward each old municipality gets its share of the merged total using the ratio it had in the last year before the merge. A split works the other way round: the old municipality's value is the sum of the new ones going forward, and going backward each new municipality gets its share of the old value using the ratio it had in the first year after the split.

The data

The rules are applied using a curated list of municipality changes — which code changed, in which year, and what it became. If the data contains a code that disappears with no matching record, the tool says so instead of guessing. All numbers come live from Statistics Norway's open API (data.ssb.no). Nothing is stored here — the file is built when you press the button and then it is gone.

The boundary changes registry

Source and coverage

The registry data comes from Statistics Norway's Klass API (data.ssb.no/api/klass), classification 131, Standard for kommuneinndeling — SSB's official register for classifications and code lists, which records every approved change to municipality codes and names. The dataset covers 2,097 recorded changes across 1,199 municipalities from 1839 to 2026, including mergers, divisions, name changes and code changes at the municipality level.

Method

Every change record and every version of the classification is fetched from the Klass API. Validity periods are split at each year a code participates in a change, so source and target periods match the historical record exactly. Change type is classified per row by how many old codes map to how many new codes on a given date: merger, division, name change, code change, or combined code and name change. Unchanged rows are dropped, so only actual boundary or identity changes appear. Each row includes the official Norwegian note from Klass, split by source and target municipality where available, and the interface generates a plain-language description summarising what happened — for example: “In 2020, several municipalities merged into one.”

Download and publisher

The full registry dataset can be downloaded as an Excel file from the button on the registry pages. The spreadsheet follows the same column layout as the original master list and can be used for analysis, mapping or research. This tool is published by Nordregio, a research institute for regional policy and planning in the Nordic countries.